data model
Congestion Modelling
Optrak holds the journey time for each stretch of road as a curve across the day or the week, rather than as one average figure. The speed data behind it is TomTom’s lorry-aware mapping, in five-minute slices, worked out from millions of recorded lorry journeys. So the optimiser gets the journey time for when the trip actually starts, not an average of the whole week.
Last updated: 2026-08-11
Key Capabilities
- Journey time held for each stretch of road as a curve across the day, not one average figure
- TomTom lorry-aware mapping, which allows for lorry bans, weight limits, low bridges and junctions an artic can use
- Five-minute slices through the week — fine enough to catch how quickly the morning peak builds
Why One Average Journey Time Fails
Traditionally, most routing software gave each stretch of road a single journey time — the same figure for a 6:30am run as for one setting off at 8:00. But a typical town journey that takes four minutes off-peak can take seven in the morning rush. That is a 75% swing, hidden behind one number.
There is no safe figure to use. Take the average, and rush-hour journeys come out too short: deliveries miss their windows, and your on-time-in-full figures suffer. To stop that happening the planner has to go in and fix the plan by hand. Go the other way and pad everything with a slowing-down factor, and you build in slack you don’t need — vehicles arriving early and waiting, or coming back with time left in the shift, which is the most valuable thing you have.
Plans that ignore the time of day don’t survive contact with the road. Drivers work around a schedule that is wrong, and planners stop trusting what comes out of the software. The cost turns up as planner hours spent rescuing plans by hand, and as delivery figures the depot manager has to explain.
What Optrak Does Instead
Optrak holds the journey time for each stretch of road as a curve across the week or the day, depending on how far ahead you are planning: for any departure time, you can read off the journey time to expect. The speed data behind it is TomTom’s lorry-aware mapping, recorded street by street in five-minute slices and worked out from millions of recorded lorry journeys.
One real journey makes the point. The charts below show journey time against departure time for a van between an office (SG12 9LR) and the BBC at W1A 1AA on an ordinary weekday, out and back. The shape of each line is the curve: pick any departure time and read off what the journey will take. The same trip takes 53 minutes overnight and 82 minutes setting off into the morning peak.
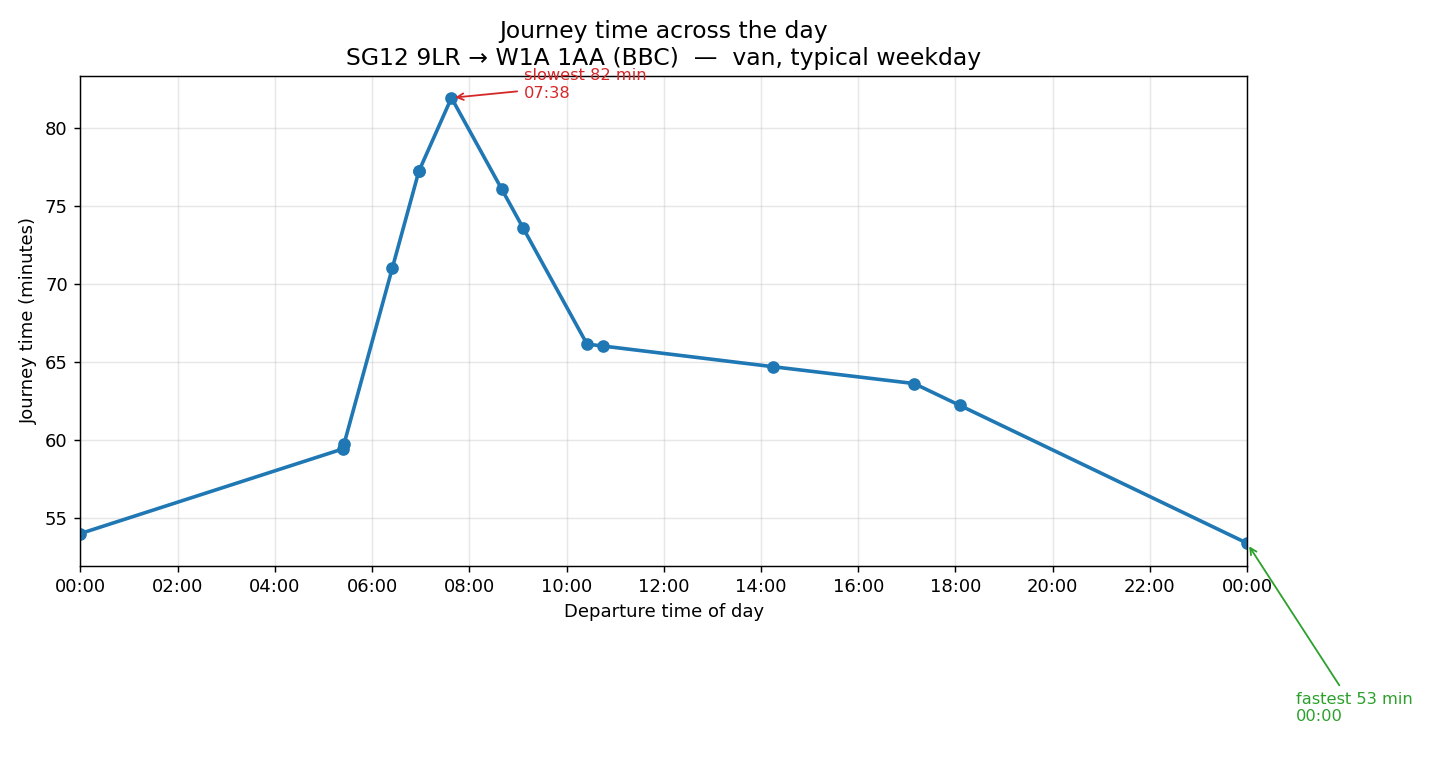
Outbound, office → BBC. The morning peak is the worst of it: 82 minutes setting off at 07:38, against 53 overnight.
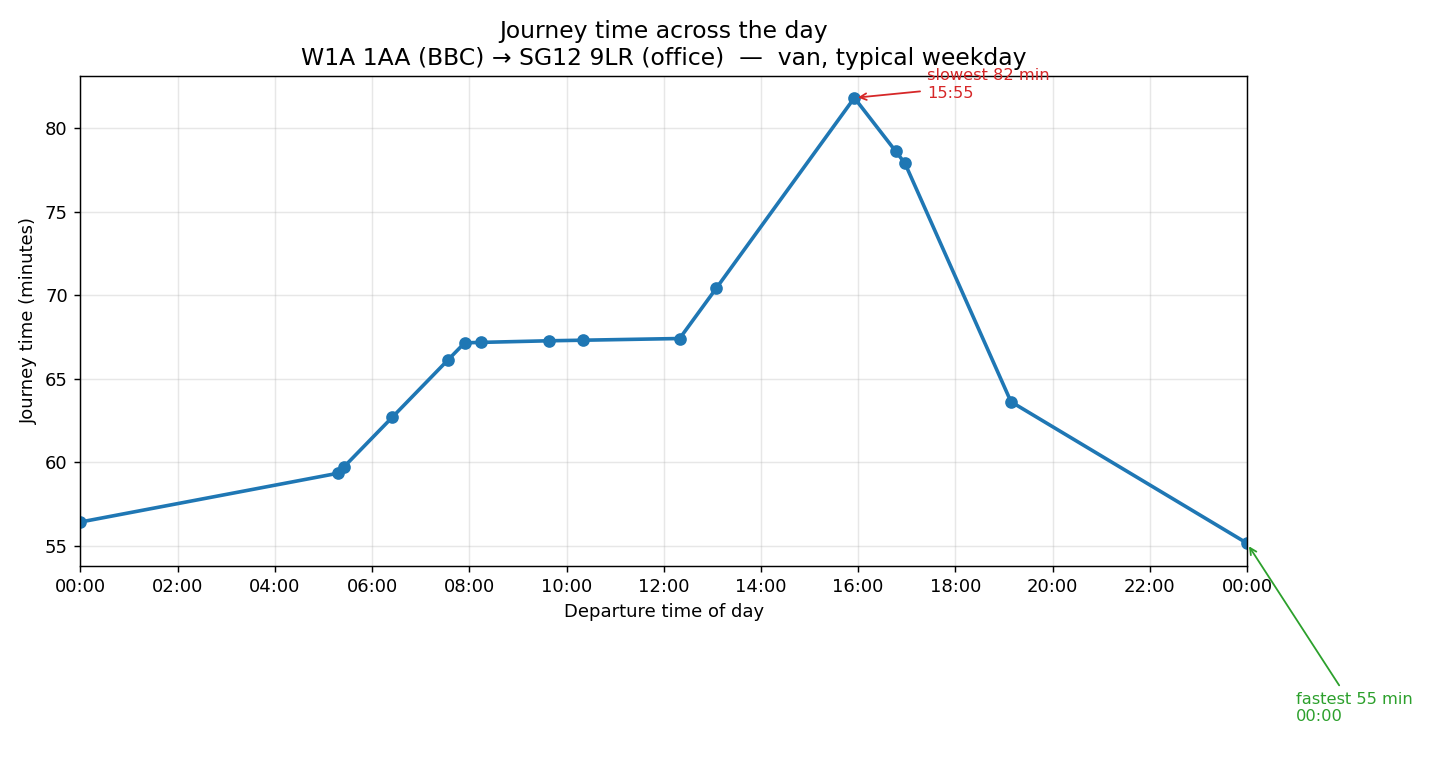
Return, BBC → office. The peak has moved to the afternoon — 82 minutes at 15:55. The same road behaves differently depending on which way you are going and when, which is why journey times are held for each direction separately rather than averaged into one.
What It Doesn’t Cover
The figures come from what a normal week looks like, which is what makes them useful for planning ahead. Accidents and short-notice roadworks aren’t in them. Where short-term disruption matters enough to an operation, a live feed can be brought in; the standard model works from the settled pattern rather than from what is happening this minute.
Technical Detail
TomTom Lorry-Aware Mapping
The data records the expected speed on each street in five-minute slices across the week. Lorry-aware rather than car-aware means it accounts for the restrictions and routes that apply to heavy goods vehicles: lorry bans, weight limits, low bridges and the rest.
The speeds are real lorry speeds, which reflect both the legal limits and the fact that a lorry gets through traffic more slowly than a car does.
Five-minute detail in the source data means local conditions are properly accounted for. That is particularly useful around the depot, because it lets the optimiser choose good times to leave and return. A round heading into a city may be much better setting off before or after the morning rush; one heading away from it hardly cares what time it leaves.
Into the Optimiser
Routing software works from prepared tables of distances and times. Optrak’s journey-time table holds a curve for each pair of points rather than a single figure, and the times vary by vehicle, equipment and driver training as well as by the clock.
Visser and Spliet’s 2020 work is the important work here: it shows how travel times that vary through the day can be calculated efficiently, by holding them as curves rather than averages. Optrak draws on many of its ideas, adapted to its own needs, particularly around driver scheduling.
How This Compares
Routing software built on the commercial mapping products (TomTom, HERE) has access to the same raw data. Optrak’s use of it is more refined than most. Some systems work from averages with a general rush-hour slowing factor. Others use coarser timings and jump from one figure to the next in steps, rather than following the curve as Optrak does.
The result is a more accurate picture, which means more reliable times, a better chance of hitting delivery windows, and more of the shift actually used.
Frequently Asked Questions
Where does the journey-time data come from?
TomTom’s lorry-aware mapping. Every street has an expected speed in five-minute slices right across the week, worked out from millions of recorded lorry journeys. Lorry-aware data allows for lorry bans, weight limits, low bridges and junctions a lorry can actually get round — things car data ignores. For HGV work, car data promises journeys that look fine on the map and can’t be driven.
How fine is the timing?
Five-minute slices across the week. The change into peak is quick — the rise from free-flowing at 6:30am to full peak at 8:00am happens fast, and lumping it into hourly figures averages away a difference that matters when you are committing to a delivery window.
How is a journey time that changes through the day actually stored?
As a curve rather than a number: for any departure time, it gives the journey time you should expect. Formally it is a piecewise linear function, which is a curve made up of straight segments — see the glossary entry. Optrak reads a journey time off the curve exactly as it would read a distance, so the time of day is part of building the round rather than something checked afterwards. Visser and Spliet (2020) is the important work on calculating travel times this way; Optrak draws on many of its ideas, adapted to its own needs, particularly around driver scheduling.
Does it know about accidents and roadworks?
Not as standard. What Optrak works from is the pattern of a normal week, which is what makes a plan reliable in advance. Accidents and short-notice roadworks are not part of that; some operations take a live feed where short-term disruption matters enough to justify it.
How does this compare with what other software does?
Journey times that vary through the day are becoming common in routing and transport software, and the TomTom lorry-aware data Optrak uses is on sale to anyone who wants to use it. Optrak is finer-grained than some products (five-minute rather than hourly) and uses lorry data rather than car data, but several products are comparable on that. What differs is that it sits in the same place as distance and energy use, read by the same optimiser as it builds the round, rather than being applied in a separate pass afterwards.
Related
Technical Summary
Per-leg journey time is represented in the routing matrices as a piecewise linear function (PLF) of start time across the week. The underlying speed data is TomTom’s truck-aware mapping, recorded per street in 5-minute time buckets and derived from analysis of millions of truck journeys. Visser and Spliet (2020) is the important work on evaluating PLF-based route changes efficiently inside neighbourhood-search heuristics; Optrak draws on many of its ideas, adapted to its own needs, particularly around driver scheduling. Optrak’s activity PLFs also vary across vehicles, equipment, and driver training. The optimiser queries the PLF the same way it queries distance, so route scheduling reflects time-of-day variation directly rather than against a flat average. 5-minute granularity captures peak transitions sharply (the morning peak’s 7am–9am rise, the evening peak fall) where coarser buckets average across them. Truck-aware data accounts for HGV-specific restrictions: lorry bans, weight limits, low bridges, commercial-vehicle-suitable junctions. The same time-of-day axis used in the journey-time PLF appears in the per-leg energy figures for EVs (see EV modelling), with both journey time and energy variation arising from the same underlying stop/start traffic patterns. Time-varying journey-time matrices are increasingly standard in routing products; the differentiation is granularity, data source (truck-aware vs car-aware), and integration — the PLF lives in the same matrix layer that holds distance, load constraints, and EV consumption, all queried by the same optimiser, not handled in separate post-construction passes.
Reference: Visser, T.R. and Spliet, R. (2020). “Efficient Move Evaluations for Time-Dependent Vehicle Routing Problems.” Transportation Science 54(4), 1091–1112. DOI: 10.1287/trsc.2019.0938.
See Optrak on Your Own Routes
Book a demo and we'll model your fleet, depots and constraints — and show the savings on real data.